Everyone says EVs save you money. Few people actually show you the math. This ev vs gas cost comparison breaks down every cost category with real 2026 figures so you can see where the numbers land for your specific situation, not some national average that may have nothing to do with how you drive. The savings are real for most drivers, but the size of the gap depends on where you live, how you charge, and what kind of driving you do. Your numbers do the deciding.
If you want to skip the spreadsheet work entirely, WattsNear’s built-in cost calculator lets you plug in your mileage, local electricity rate, and current MPG to get a personalized annual savings estimate in under a minute. The goal here is clarity, not cheerleading.
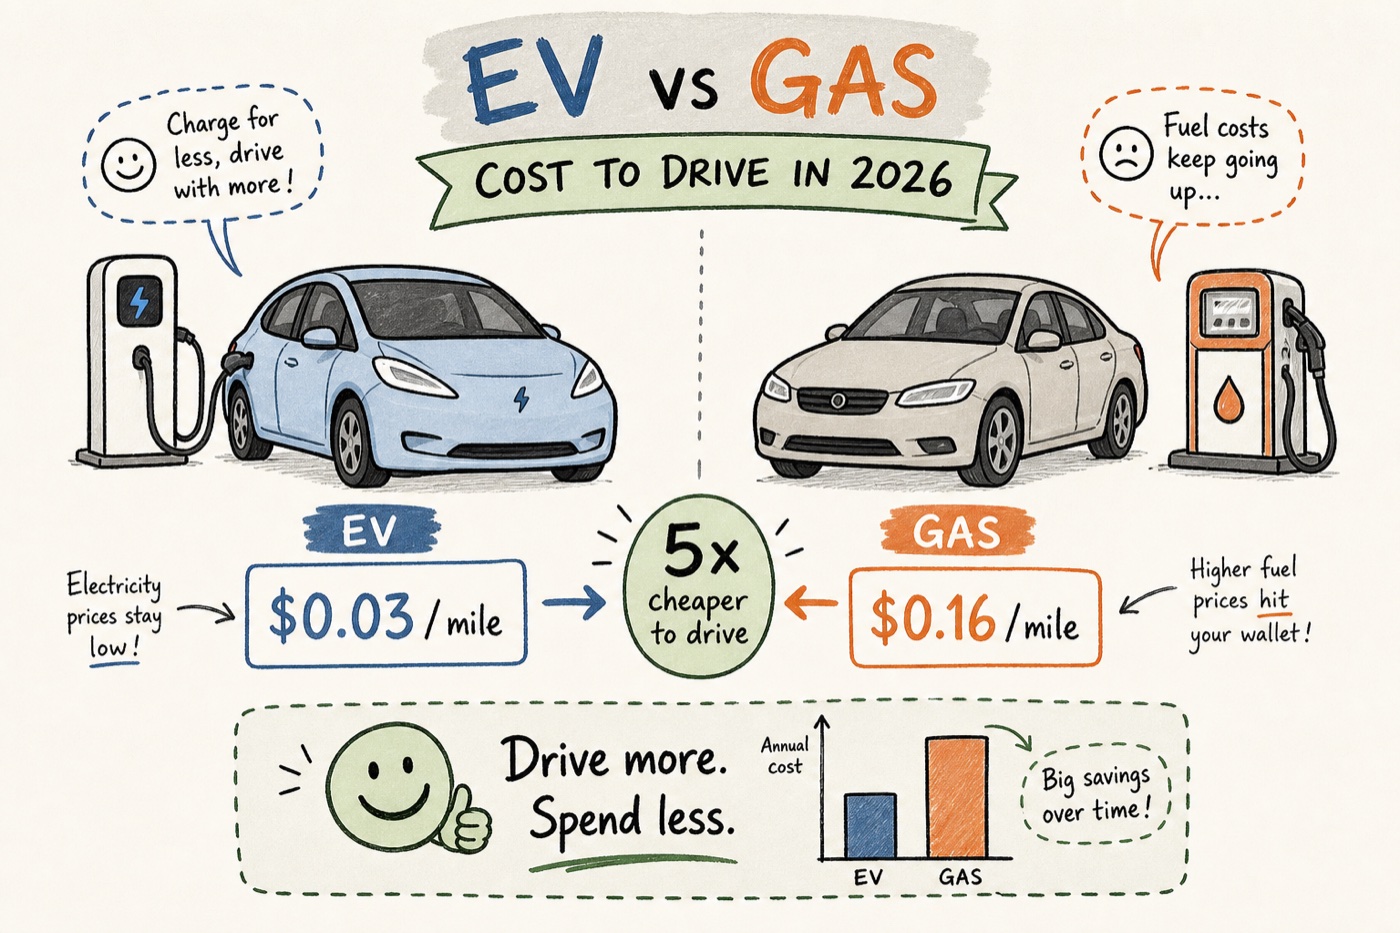
EV vs gas cost comparison: what it actually costs to drive electric in 2026
The cost per mile for electricity is the foundation of the entire comparison. Most people know electricity is cheaper than gas in theory. The actual number swings more than people expect depending on how and where you charge.
Home charging is where the real savings live
The national average residential electricity price sits at 17.65 cents per kWh as of May 2026, up 7.4% year over year (U.S. Energy Information Administration). At that rate, a typical mid-size EV consuming around 28 to 30 kWh per 100 miles costs roughly $0.04 to $0.06 per mile on a Level 2 home charger, once efficiency losses are factored in. That’s the number that matters most, because roughly 86% of EV charging happens at home. For drivers in low-rate states like Idaho (12.63 cents/kWh) or North Dakota (11.64 cents/kWh), the EV cost per mile can drop as low as $0.03 at off-peak rates.
The math is straightforward. At $0.05 per mile and 13,500 miles per year, close to the U.S. average based on FHWA data, annual charging costs come out to around $675. That number alone starts to tell the story.
Public charging costs more, sometimes a lot more
Public Level 2 stations average $0.07 to $0.10 per mile once session fees and network markups are factored in. DC fast charging pushes that to $0.13 to $0.20 per mile at peak rates — at the high end of DCFC pricing, you’re approaching what gas costs per mile. Drivers who rely heavily on fast charging for daily use will see their fuel savings shrink fast. This is why your actual charging mix matters far more than any single headline figure. If 80% of your charging is at home and 20% is a mix of Level 2 and occasional DCFC, your blended cost per mile stays well below $0.08.
The gas side: what you’re actually paying per mile in 2026
Gas prices have climbed sharply this spring. According to AAA’s weekly pump price report (May 12, 2026), the national average for regular gasoline is $4.50 per gallon, up about 40% compared to May 2025. That changes the fuel cost math meaningfully compared to a year ago.
What average MPG actually looks like at the pump
A mid-size sedan averaging 28 to 30 MPG in real-world driving costs around $0.15 per mile in fuel at $4.50 per gallon. A mid-size SUV or truck getting 20 MPG lands at $0.225 per mile. Compare either figure to EV home-charging costs of $0.04 to $0.06 per mile and the gap is not subtle. At 13,500 miles per year, the difference between a 28 MPG gas sedan and an EV charged primarily at home works out to roughly $1,300 to $1,500 annually in fuel costs alone. That gap compounds every year you own the vehicle.
MPGe and why it matters for an apples-to-apples comparison
MPGe is the EPA’s efficiency metric for EVs expressed in gas-equivalent terms. A vehicle rated at 120 MPGe travels 120 miles on the same energy content as one gallon of gasoline. Translated to per-mile cost, even public Level 2 charging beats most gas vehicles at current pump prices. The only scenario where gas approaches competitiveness is when EV drivers rely exclusively on DC fast charging at peak rates, which is not how most people drive.
Maintenance savings that most buyers underestimate
Fuel savings get the headlines. Maintenance is often the second-biggest financial advantage of EV ownership. Most buyers never see it itemized before they purchase.
What EVs eliminate entirely (and what stays)
EVs have no oil changes, no spark plugs, no transmission service, and significantly reduced brake wear due to regenerative braking. Annual routine maintenance for a mainstream EV runs $100 to $400, compared to $350 to $700 for a comparable gas car, per Consumer Reports data. Scale that over five years and you’re looking at roughly $2,000 to $2,800 total for EVs versus $4,400 to $5,000 for gas vehicles. That’s $400 to $800 per year in maintenance savings that never shows up on a fuel cost calculator but absolutely affects your total spend.
The tire cost reality no one talks about
EV tires are a genuine cost that surprises a lot of new owners. Heavier battery packs and instant torque accelerate wear, and EV-specific tires run $160 to $380 per tire for mainstream models, with replacement intervals of roughly 20,000 to 45,000 miles depending on the tire. Budget an extra $150 to $300 per year compared to a gas car. Brands like Goodyear ElectricDrive 2 and Bridgestone Turanza EV run $200 to $260 per tire with 45,000 to 50,000 mile warranties, the more economical end of the spectrum. The tire cost closes the maintenance advantage a bit, but it doesn’t erase it.
Up-front price and what’s left of the incentives
The 2026 incentive landscape has shifted more than most people realize. Per IRS guidance, the federal EV purchase tax credit expired on September 30, 2025, which directly changes the up-front math for anyone buying this year.
How federal credit expiration changes the sticker price reality
Without the $7,500 federal credit, EVs carry a more visible premium than they did even a year ago. According to Kelley Blue Book transaction data from early 2026, average transaction prices sit around $54,500 for EVs versus $48,700 for comparable gas vehicles, a gap of roughly $5,800. That said, the gap is narrowing at the lower end of the market. The Chevy Equinox EV and its gas counterpart are both available around $27,000 at the transaction level in some markets, where parity is effectively real. The purchase premium varies significantly by segment, so the average figure masks a lot of variation.
State rebates and programs that still move the needle
Several states have stepped up with programs that partially replace the expired federal credit. California’s Clean Vehicle Rebate Project still offers up to $7,500 for eligible buyers. Colorado’s Vehicle Exchange Colorado program provides up to $6,000 for income-eligible buyers trading in a gas vehicle. Illinois offers $4,000 rebates on a first-come basis. The federal 30C home charger tax credit, which covers 30% of installation costs up to $1,000 per IRS guidance, remains active for chargers placed in service by June 30, 2026. Stack the right combination of state and federal programs and the purchase premium can effectively disappear, particularly in high-incentive states.
EV vs gas cost comparison: running real 5-year numbers for 2026
This is where the individual variables combine into an actual answer. Rather than showing abstract ranges, here’s a concrete scenario using a driver doing 13,500 miles per year who charges primarily at home.
A side-by-side for a mainstream EV versus a comparable gas sedan
Take a mid-size EV (28 kWh/100 miles, $54,500 purchase) against a gas sedan (30 MPG, $48,700 purchase) at 13,500 miles per year with gas at $4.50 per gallon. Annual fuel cost for the EV: roughly $675 at the national average electricity rate. Annual fuel cost for the gas car: roughly $2,025. That’s a $1,350 annual fuel advantage for the EV. Add $400 to $800 in annual maintenance savings and the operational advantage reaches $1,750 to $2,150 per year. Over five years, the total cost of ownership favors the EV by $8,750 to $10,750 in operational savings against a $5,800 purchase premium, without any incentives applied. In scenarios where buyers combine state rebates with the remaining charger credit, breakeven can arrive by year three; without incentives, most drivers reach it before year four.
- Annual fuel savings vs. 30 MPG gas sedan at $4.50/gal: $1,350
- Annual maintenance savings (net of tire costs): $400–$800
- 5-year operational savings: $8,750–$10,750
- Purchase premium without federal credit: ~$5,800
- Estimated breakeven: year 3 to 4 depending on state incentives
The variables that actually swing the result
Three factors matter more than anything else in this electric vs gas cost comparison: your home electricity rate, your annual mileage, and how much of your charging happens at home versus DC fast charging. High-mileage drivers in low-electricity states like Texas (15.41 cents/kWh) or Idaho (12.63 cents/kWh) see the fastest payback and the widest long-term advantage. Low-mileage drivers in California (30.72 cents/kWh) or Hawaii (43 cents/kWh) face a longer runway to break even, especially if they rely on public charging. The math is not the same for everyone, which is exactly the point.
WattsNear’s EV vs. gas cost calculator is built for this. Enter your local electricity rate, your estimated annual miles, and your gas car’s MPG, and it returns a personalized annual savings figure without any spreadsheet work. It’s one of the features built directly into the app alongside the station finder, because knowing what charging costs is just as useful as knowing where to charge.
The numbers favor EVs, but your numbers are what matter
This ev vs gas cost comparison shows that EVs come out ahead for most U.S. drivers in 2026, and with gas at $4.50 per gallon, the gap has widened compared to recent years. The average driver charging mostly at home and covering 13,500 miles per year will likely save $8,000 to $11,000 over five years on fuel and maintenance combined, more than covering the current purchase premium even without federal incentives.
The variables to nail down for your own situation are your local electricity rate, how often you’ll use DC fast charging, and what state rebates apply where you live. National averages give you a direction. Your actual numbers give you a decision. Run the calculation with your real figures and the answer is usually better than expected.
If you want a fast read on your annual savings without building a spreadsheet, WattsNear handles the math in under a minute. When you’re on the road and need the nearest charger at the best rate, the app covers that too.